MARKETS & MATERIALS
Data & sources →

Top 25 issuers by reported market capitalization in The Weekly 250. Prices: 2 Oct 2026 close. Changes: versus 2026-09-25; not live.

THE GLOBAL FINANCIAL WEEKLYSeptember 28–October 4, 2026Vol. 01 · No. 001
THE WORLD AT A GLANCE

World markets

Reference snapshot

Financial centers · Natural Earth

S&P 5007,722.72

index points ·

EUR / USD 1.12045 Oct 2026 · USD per EUR

Dated observations · not live quotes
How to read this map

Currency cross-rates show local-currency units per U.S. dollar, calculated from the same ECB euro reference snapshot. The U.S. card leads with a dated S&P500 index close and shows USD per EUR beneath. Pins locate financial centers; currency references are not exchange-specific prices.

Choose a region with the arrow keys, then use the Market selector. Policy settings and equity-index levels retain their own dates. Shading shows the selected region, not market performance.

All observations, definitions & sources →

THE NEWS DESK

The week. Across every market.

Original reporting and analysis for September 28–October 4, 2026. Written October 5, 2026.

Read the latest edition’s coverage across our six reporting desks. Free reports establish the facts; premium articles examine the implications.

Explore the topic guides →

Economy & Policy

Full section →

Labor Markets, Consumer Balance Sheets & Demographics

U.S. payroll growth after revisions

Thousands of jobs

-1061.5133-10July133August29September
BLS October 2 vintage; July and August revised, September preliminary. Seasonally adjusted monthly nonfarm payroll changes.

Sources: [1] BLS September Employment Situation · 2026-10-02

Hiring Slows, While Household Spending Outruns Income

September payroll growth was modest and prior months were revised lower; the latest consumption figures describe a consumer still spending, but with less monthly saving.

Read the report →

Inflation Tracker

U.S. August inflation: different baskets

% year over year

01.73.43.4CPI headline2.4CPI ex food &energy3.4PCE headline3PCE ex food &energy
Same August 2026 reference month. CPI released Sep 11; PCE released Sep 30. The baskets and methods differ.

Sources: [1] BEA Personal Income and Outlays, August 2026 · 2026-09-30; [3] BLS CPI, August 2026 · 2026-09-11

Energy Keeps the Inflation Fight Unfinished

August U.S. PCE prices and September euro-area estimates show different measures, but a common problem: headline pressure remains above central-bank goals.

Read the report →

U.S. Federal Reserve

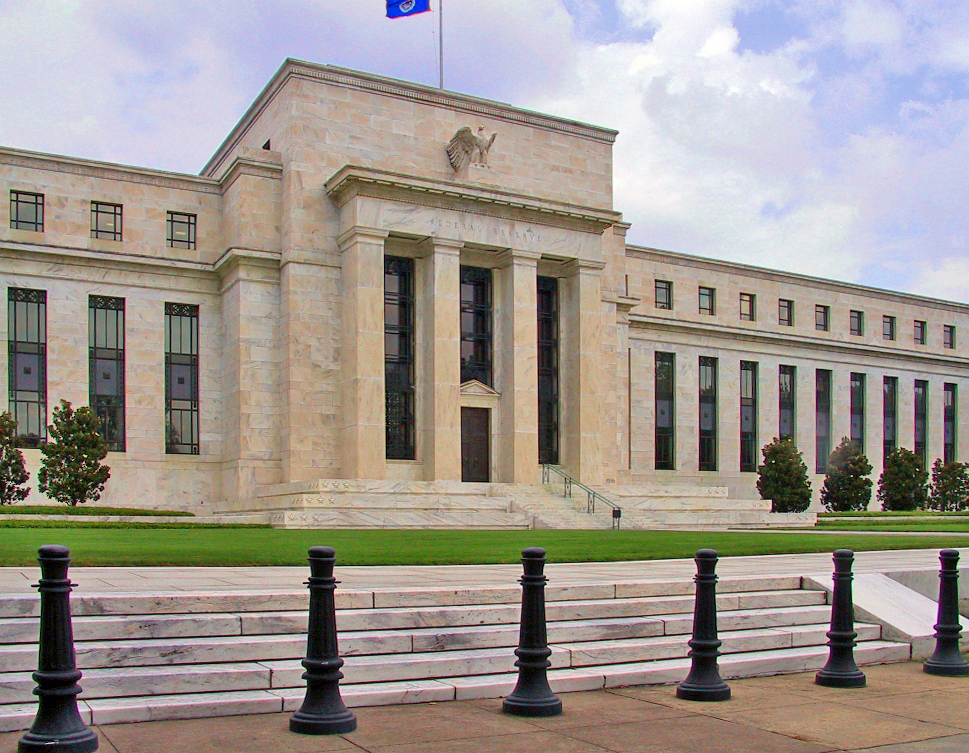
Federal Reserve headquarters, Washington, D.C.
Archival context · Federal Reserve headquarters, Washington, D.C. · 2004-09-05. Dan Smith (Rdsmith4) / Wikimedia Commons; perspective and brightness edit by Dontworry. Image source · Usage terms. Display cropped to fit. Full credits.

A Slower Jobs Report Meets a Fed Still Focused on Prices

The week brought new employment evidence after a September rate increase, while the central bank’s projections continue to distinguish a conditional outlook from a commitment.

Read the report →

Non-U.S. Central Banking

Selected policy settings at issue cutoff

% nominal annual rate

01.883.752.5ECB deposit1.25BoJ call target3.75BoE Bank Rate0SNB policy
Different instruments, not a ranking of policy restraint. Decisions Sep 10, Sep 18, Sep 17 and Sep 24 respectively; BoJ effective Sep 24; ECB effective Sep 16.

Sources: [3] BoJ money-market guideline decision · 2026-09-18; [4] BoE September MPC summary and minutes · 2026-09-17; [5] SNB September monetary-policy assessment · 2026-09-24; [6] ECB September monetary-policy decision · 2026-09-10

Central Banks Adjust the Plumbing as Rates Stay in Focus

ECB collateral changes and new Bank of Japan meeting opinions show why implementation details deserve a place beside headline policy rates.

Read the report →

Monetary Policies

RBA September 29 decision

% cash-rate target

02.34.64.35Previous target4.6New target
A 25-basis-point increase, announced September 29, 2026. The bar chart displays levels, not the percentage change in the rate.

Sources: [1] RBA September 29 monetary-policy decision · 2026-09-29

Australia Raises Rates as the Global Policy Map Diverges

The RBA’s September 29 increase highlights renewed inflation pressure; exchange-rate and interest-rate systems still require different measures of policy.

Read the report →

Sovereigns & World Trade

Full section →

Fiscal Governing Bodies

From policy announcement to operating rule

Status map

01Proposal or agenda
02Consultation
03Final decision
04Effective date
05Supervision and enforcement
Editorial process diagram. Not every action follows every stage; this week’s releases occupy different points.

Sources: [1] Basel Committee October 1 meeting release · 2026-10-01; [2] Federal Reserve stress-test changes · 2026-09-30; [3] FCA crypto authorization gateway · 2026-09-30; [4] SEC private-market proposals · 2026-09-30; [5] ESMA 2027 priorities · 2026-09-28

Rulemakers Move, but the Legal Status of Each Step Matters

From Basel’s bank standards to the UK crypto gateway, the week’s institutional news mixes final decisions, proposals and future implementation dates.

Read the report →

Sovereign Debt & Fiscal Policy

Brazil: August federal public debt composition

% of federal public debt

026.3752.7452.74Floating rate23.22Inflation linked20.31Fixed rate
Selected categories, end-August 2026. Remaining 3.73% is the residual FX-linked category by arithmetic; bars intentionally do not purport to show a full pie.

Sources: [1] Brazil National Treasury August 2026 debt report · 2026-09-28

Brazil’s Debt Mix Shows Why the Total Is Only the Beginning

A new monthly debt report highlights floating-rate exposure and refinancing structure; global fiscal risks require attention to terms, maturity and the quality of the underlying data.

Read the report →

Foreign Exchange/Global Currency

Highest unit values in the saved coverage set

USD per currency unit

01.623.243.24KWD2.66BHD2.6OMR1.41JOD1.33GBP
Archived ExchangeRate-API snapshot Oct 1, 2026,00:02:31 UTC; top 5 of 152 priced active fiat currencies. Denomination only, not purchasing power or investment merit.

Sources: [4] ExchangeRate-API snapshot preserved in reference-chat currency tracker · 2026-10-01T00:02:31Z; archived local snapshot

Euro Slips Against the Dollar as Policy Pressures Diverge

Dated central-bank reference rates show a 1.56% euro decline against the dollar from September 25 to October 2; denomination rankings answer a different question.

Read the report →

Markets & Investing

Full section →

Alternative Asset Classes

Historical Q1 2026 private-market returns

net pooled return %

-1.092.275.64-1.09U.S. private equity5.64U.S. venture capital-0.4Real estate
Cambridge Associates benchmark books; quarter ended March 31, 2026. Distinct fund universes; not current-week returns.

Sources: [2] Cambridge U.S. private-equity Q1 2026 benchmark · Q1 2026; August file vintage; [3] Cambridge U.S. venture-capital Q1 2026 benchmark · Q1 2026; August file vintage; [5] Cambridge real-estate Q1 2026 benchmark · Q1 2026; August file vintage

Private-market access debate turns to the price of management

A new SEC proposal puts incentive compensation in focus while lagged private-market benchmarks underline the importance of cash realizations.

Read the report →

Derivatives Markets

CME September 2026 daily activity

million contracts / day

08.116.216.2Rates8.1Equityindex3.1Energy1.9Agriculture1.4FX1Metals
CME October 2 release. Contract sizes differ; categories shown are rounded and are not risk-equivalent dollar exposures.

Sources: [1] CME September and Q3 volume release · 2026-10-02

Record futures activity puts risk transfer in the spotlight

CME reports a busy September as volatility falls on Friday; higher turnover is a measure of activity, not a directional verdict.

Read the report →

Pooled Investment Vehicles

Long-term fund demand splits by vehicle

USD bn

-19.6710.0739.81-19.67Mutual funds39.81ETF net issuance20.14Combined
ICI release September30; estimated week ended September23, 2026. These are flows/net issuance, not returns.

Sources: [1] ICI combined long-term flows and ETF issuance · 2026-09-30; observations September23

Fund flows favor ETFs as interval-fund rules face revision

New weekly flow estimates and a pending SEC proposal illuminate two different kinds of pooled investment: daily exchange access and scheduled repurchases.

Read the report →

Debt & Fixed Income Markets

Treasury curve at the latest verified date

yield %

4.685.25.714.782 years5.2410 years5.6130 years
Federal Reserve H.15 via FRED, October1, 2026; published October2. Not October2 closing yields.

Sources: [1] Federal Reserve two-year constant-maturity yield via FRED · 2026-10-01; published October2; [2] Federal Reserve ten-year constant-maturity yield via FRED · 2026-10-01; published October2; [3] Federal Reserve thirty-year constant-maturity yield via FRED · 2026-10-01; published October2

Treasury curve steepens as long maturities retain a higher yield

The verified October 1 curve shows a wider long-versus-short gap than the prior Friday, while auction and credit data require separate interpretation.

Read the report →

Cryptocurrency

Dated crypto market-cap snapshot

USD bn

0838.871,677.731,677.73Bitcoin327.96Ethereum183.82Tether
CoinGecko source snapshot October1, 2026 at13:17:30UTC. Circulating market caps; not reserves, Sunday quotes or full-week returns.

Sources: [4] CoinGecko markets endpoint; October1 raw snapshot archived in reference chat · 2026-10-01T13:17:30Z

Crypto custody moves to the center of the regulatory agenda

The SEC proposes a tailored framework for advisers and funds as exchange derivatives activity underscores the market’s institutional connections.

Read the report →

Credit & Property

Full section →

Avoiding Financial Calamity

Federal Reserve reserve balances

USD billions

01,474.052,948.092,930.19Sep 23 average2,948.09Sep 30 average2,881.69Sep 30 Wednesday
Weekly averages versus a separately labeled Wednesday observation. Sep 23 calculated as Sep 30 average less the reported weekly increase. Not a bank-by-bank liquidity measure.

Sources: [3] Federal Reserve H.4.1 · 2026-10-01

Risk Watch: Separate the Shock From the System That Amplifies It

A fresh Bank of England warning puts sovereign markets, leveraged finance and operational resilience on the same map; evidence of vulnerability is not proof of a crisis.

Read the report →

Real Estate & Commercial Property Debt (CRE)

Hotel collateral: nonperforming shares

%

05.1710.3410.34Limited service5.86Full service3.89Extended stay
Trepp study published September 28, 2026; provider securitized lodging universe and mixed-date underlying financials.

Sources: [3] Trepp: Limited-service hotel debt · 2026-09-28

Property debt expands as distress takes different paths

A record mortgage stock, higher CMBS arrears and a stressed hotel segment show why one property-market average is insufficient.

Read the report →

Short-Term Funding Markets

Federal Reserve headquarters, Washington, D.C.
Archival context · Federal Reserve headquarters, Washington, D.C. · 2004-09-05. Dan Smith (Rdsmith4) / Wikimedia Commons; perspective and brightness edit by Dontworry. Image source · Usage terms. Display cropped to fit. Full credits.

Quarter-end cash movements test funding markets

Money-fund assets declined as repo activity expanded; the combination warrants careful interpretation, not an automatic crisis label.

Read the report →

Private Credit Sub-Sectors

Wingspire 2026-1: financing scale

USD mn

0219.09438.18438.18Collateral value407.07Notes issued
KBRA September 28 rating release; collateral cutoff August 31. Difference is not a complete measure of every class's credit protection.

Sources: [1] KBRA Wingspire Equipment Finance 2026-1 ratings · 2026-09-28

Equipment finance shows how private credit reaches the bond market

A $407 million Wingspire securitization provides a concrete funding event amid a wider debate over credit quality and sector concentration.

Read the report →

Private Credit and Non-Banking Financial Intermediation (NBFI)

Semi-liquid private credit: historical U.S. scale

USD bn

0212.5425425Gross assets241Net assets
Federal Reserve May 2026 FSR; historical data underlying its private-credit discussion, not October assets. Gross and net assets must not be added.

Sources: [2] Federal Reserve May Financial Stability Report: funding risks · 2026-05-08; updated May 28

Private-credit withdrawals keep attention on the links between funds and banks

British regulators highlight persistent pressure, while the broader question is how separate balance sheets respond to the same shock.

Read the report →

Companies & Capital

Full section →

M&A + Buy/Sell Signaling

Lifecore common-share consideration

USD per common equivalent

03.146.286.28Cash at closing3.39Potential CVR increment
Issuer illustration: potential combined amount up to $9.67; CVR increment is contingent and non-tradable, not current cash or fair value.

Sources: [3] Lifecore: Agreement with Webster Equity Partners · 2026-09-28

AMD Makes an $8.2 Billion Bet on Model Research

World Labs agreement and a contingent healthcare buyout show why deal terms matter as much as headline values.

Read the report →

Private Market Offerings

Snowflake base convertible issuance

USD billions principal

0122Due 20291.75Due 2031
Priced September29; excludes optional additional notes. Zero regular coupon; conversion and other terms apply.

Sources: [1] Snowflake: Upsized $3.75 billion convertible pricing · 2026-09-29

Private Capital Raises Put Terms and Custody in Focus

Snowflake prices a larger convertible deal as an SEC pre-IPO fund complaint highlights the distance between an underlying company and the investor’s actual claim.

Read the report →

Antitrust & Financial Oversight

The legal stage determines what can be claimed

Illustration

01Complaint or concern
02Proposed resolution
03Binding decision
04Implementation evidence
Editorial process diagram. Cases may settle, be dismissed or follow different paths; a proposal is not a final order. Sources: FTC and DOJ documents. [1,3]

Sources: [1] FTC and states announce proposed Corteva pesticide settlement · 2026-09-28; [3] DOJ statement of interest in meatpacking-worker litigation · 2026-09-29

Regulators Press for Changes in Commercial Conduct

Pesticide distribution, hotel pricing and adviser referrals put contracts and incentives at the center of the week’s oversight news.

Read the report →

Resources & Technology

Full section →

Rare Earth Metals

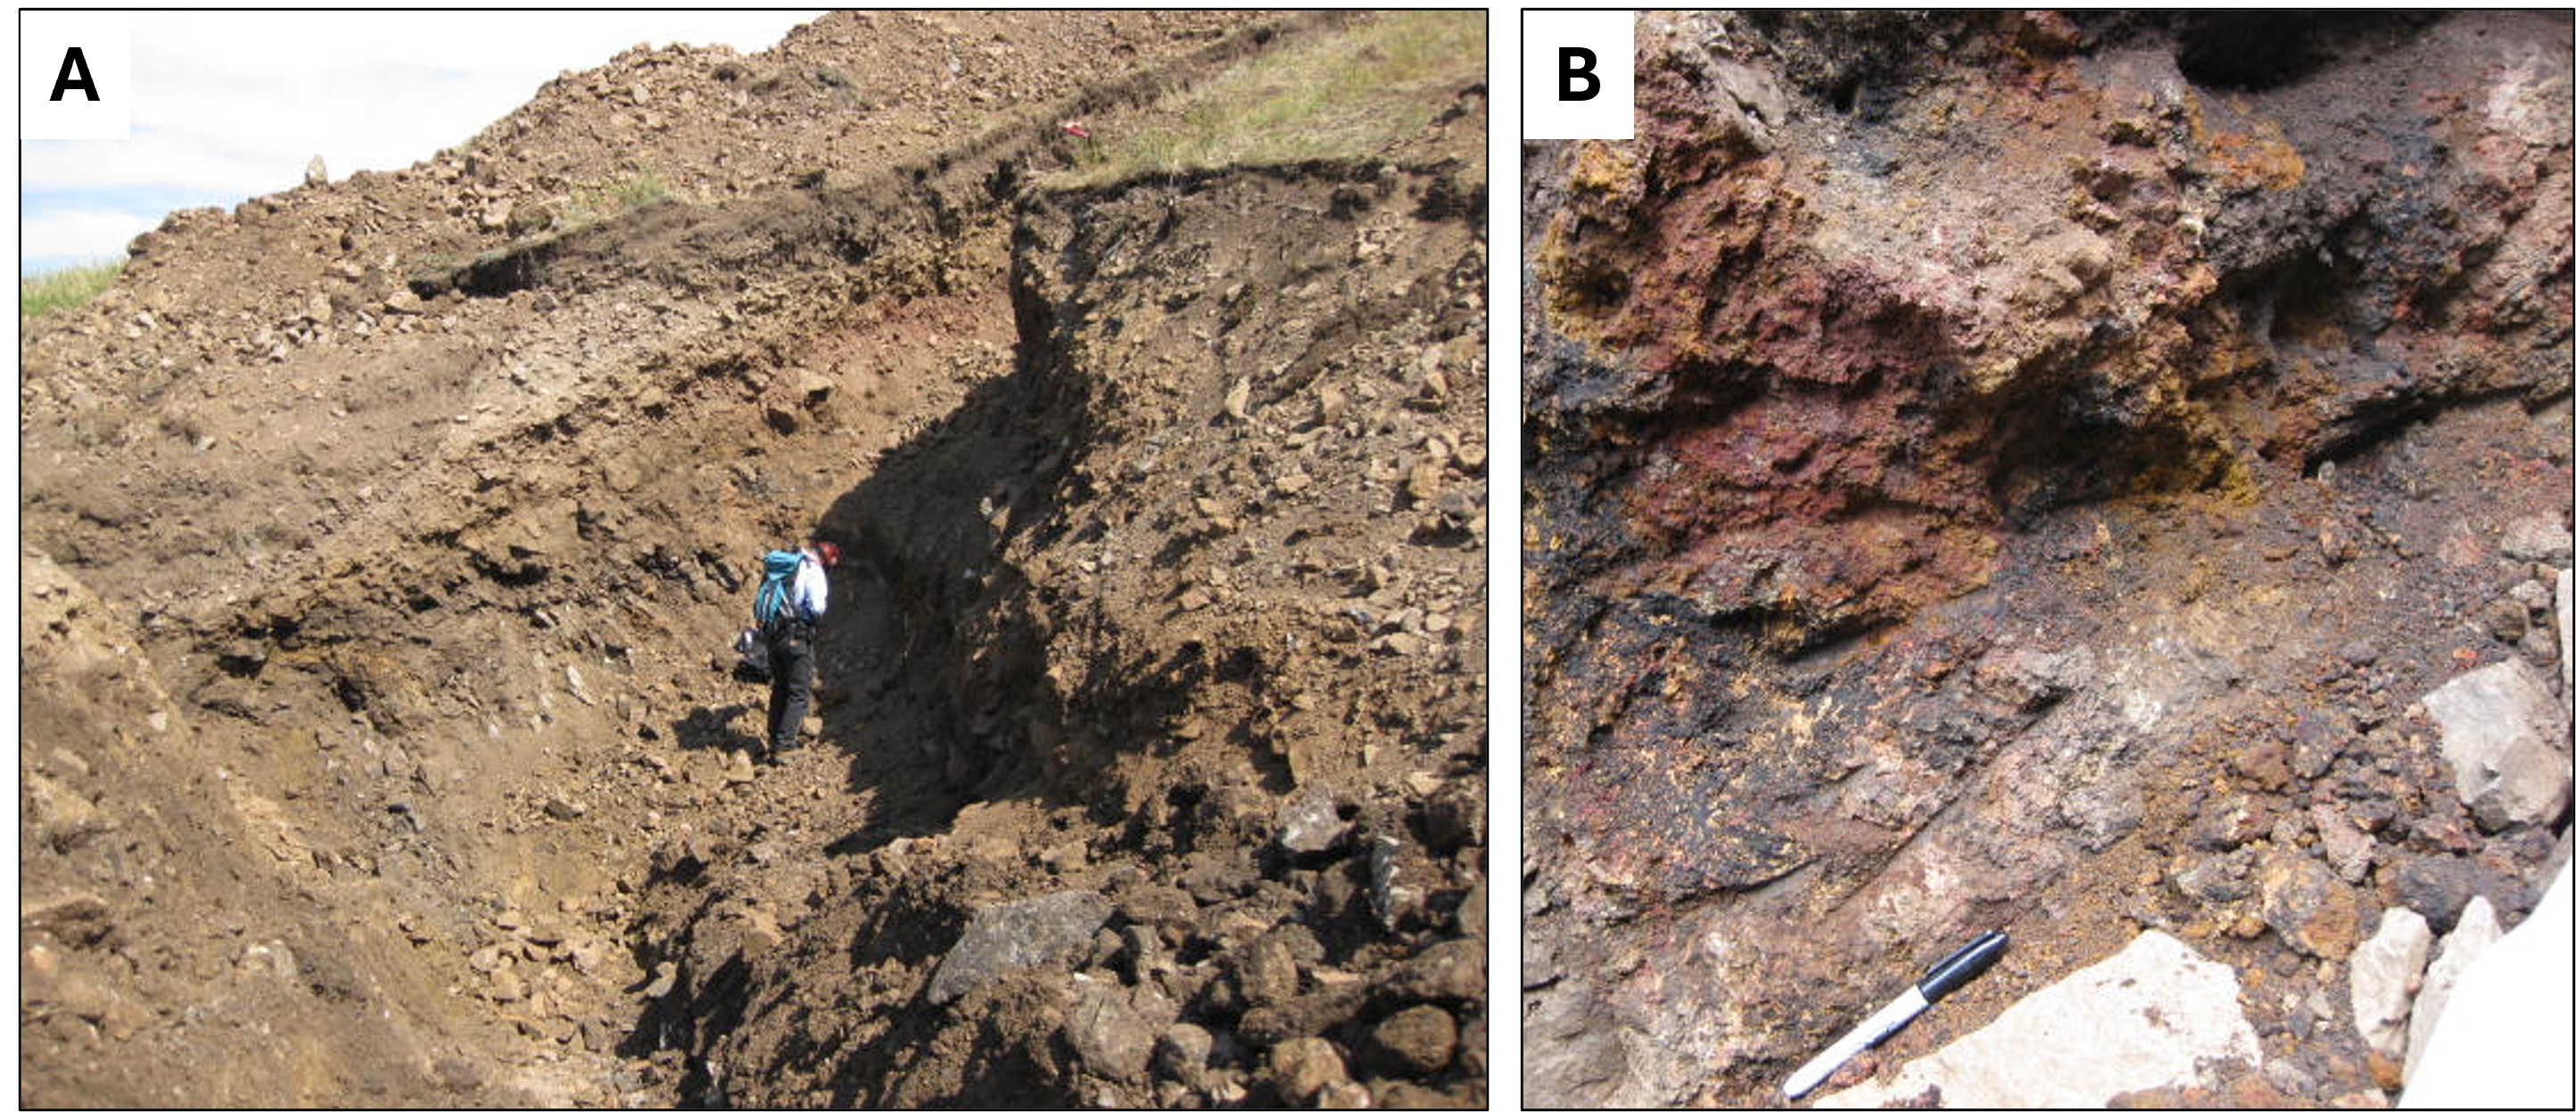
Rare-earth exploration trench, Bear Lodge Mountains, Wyoming
Archival context · Rare-earth exploration trench, Bear Lodge Mountains, Wyoming · approximately 2012. Philip Verplanck / U.S. Geological Survey. Image source. Display cropped to fit. Full credits.

Washington Funds the Work Between Ore and Magnet

New laboratory selections target processing; the commercial test remains qualified material delivered to a customer.

Read the report →

Commodities

Petroleum weekly stock changes

million barrels

-7-3.050.90.9Commercial crude-1.7Gasoline-2.3Distillate-7Total ex-SPR
EIA week ended Sep25, released Sep30. Changes are source-rounded; total includes additional categories.

Sources: [1] EIA: Petroleum balance sheet, week ended September 25 · 2026-09-30

Oil and Grain Inventories Tell Different Stories

New U.S. releases show a petroleum product draw and a larger corn carryover; broad commodity labels conceal divergent balances.

Read the report →

Strategic Resources

Rare-earth exploration trench, Bear Lodge Mountains, Wyoming
Archival context · Rare-earth exploration trench, Bear Lodge Mountains, Wyoming · approximately 2012. Philip Verplanck / U.S. Geological Survey. Image source. Display cropped to fit. Full credits.
Resource Security Extends Beyond the Mine

Federal recovery outreach and a new science funding call put processing capability, skills and technology into the supply-security debate.

Read the report →